![Best Logging Solution for Docker [Basic Version]](https://cdn.hashnode.com/res/hashnode/image/upload/v1625404988207/hpCJimcOG.jpeg?w=1600&h=840&fit=crop&crop=entropy&auto=compress,format&format=webp)
Best Logging Solution for Docker [Basic Version]
Let's see how can you ace the logging setup for your containerized applications running with Docker!


Table of contents
- 1. Configuring the Logging Driver for Docker
- - Install the driver
- - Configure the Docker to send logs to Loki Instance
- - Restart the Docker Daemon on each node
- 2. Setting up the Loki instance with its config file
- - Observe the config file loki-local-config.yaml
- - Now Install the stack
- - Verify that everything is working fine.
- 3. Setting up Grafana Dashboard to visualize the logs.
- Using Grafana
Logs are important, right? While debugging something, It helps us more than anything.
Generally, we use commands to check logs of each container, for example,
docker logs -f container_1
and it is fine for a few containers, but suppose, you have a complex architecture, where you are using Docker Swarm or Docker-Compose or just assume you have a number of containers, then what?
Yes! It will be a real pain to maintain those logs, on top of that, other issues like No sharing of logs with the team, No Access-based control, etc. will also be there.
I bet the native Docker plugin kinda feeling similar as below right now :
Let's try a solution for that :)
We will be using Loki and Grafana to achieve our goal. Loki is a set of components that can be composed into a fully-featured logging stack. More info here and here
Before we jump into installation and all other intense stuff, let's see what benefits are we going to get by end of this installation:
- Restricted User Access
- Organization Support
- Log Rotation
- Centralisation of logs
- Visualize various logs in a single place using Loki Queries.
- Live Tailing of logs
Let's start the setup:
- Configuring the Logging Driver for Docker
- Setting up the Loki instance with its config file
- Setting up Grafana Dashboard to visualize the logs.
1. Configuring the Logging Driver for Docker
*you need to repeat these steps for each Docker node if you are using Docker Swarm
- Install the driver
docker plugin install grafana/loki-docker-driver:latest --alias loki --grant-all-permissions
- Configure the Docker to send logs to Loki Instance
{
    "debug" : false,
    "log-driver": "loki",
    "log-opts": {
        "loki-url": "http://127.0.0.1:3100/loki/api/v1/push"
    }
}
- Restart the Docker Daemon on each node
# Check the number of the nodes in your swarm
docker node ls
# Drain the node so the running workload can be shifted to other nodes.
docker node update --availability drain node1_name
# Restart the docker daemon on that node
systemctl restart docker
# Make the node active again
docker node update --availability active node1_name
2. Setting up the Loki instance with its config file
To get the codebase, Clone my fork
git clone https://github.com/k4kratik/loki
- Observe the config file loki-local-config.yaml
auth_enabled: false

server:
  http_listen_port: 3100

ingester:
  lifecycler:
    address: 127.0.0.1
    ring:
      kvstore:
        store: inmemory
      replication_factor: 1
  chunk_idle_period: 15m

schema_config:
  configs:
  - from: 2019-06-01
    store: boltdb
    object_store: filesystem
    schema: v9
    index:
      prefix: index_
      period: 168h

table_manager:
.
.
.
# Notice this
  retention_deletes_enabled: true
  retention_period: 672h
...
Here we are setting up the auto-deletion of old logs after a certain period, which is 28 days (672 Hours) in our case.
- Now Install the stack
docker stack deploy -c docker-compose.yml loki-stack
- Verify that everything is working fine.
docker service ls
3. Setting up Grafana Dashboard to visualize the logs.
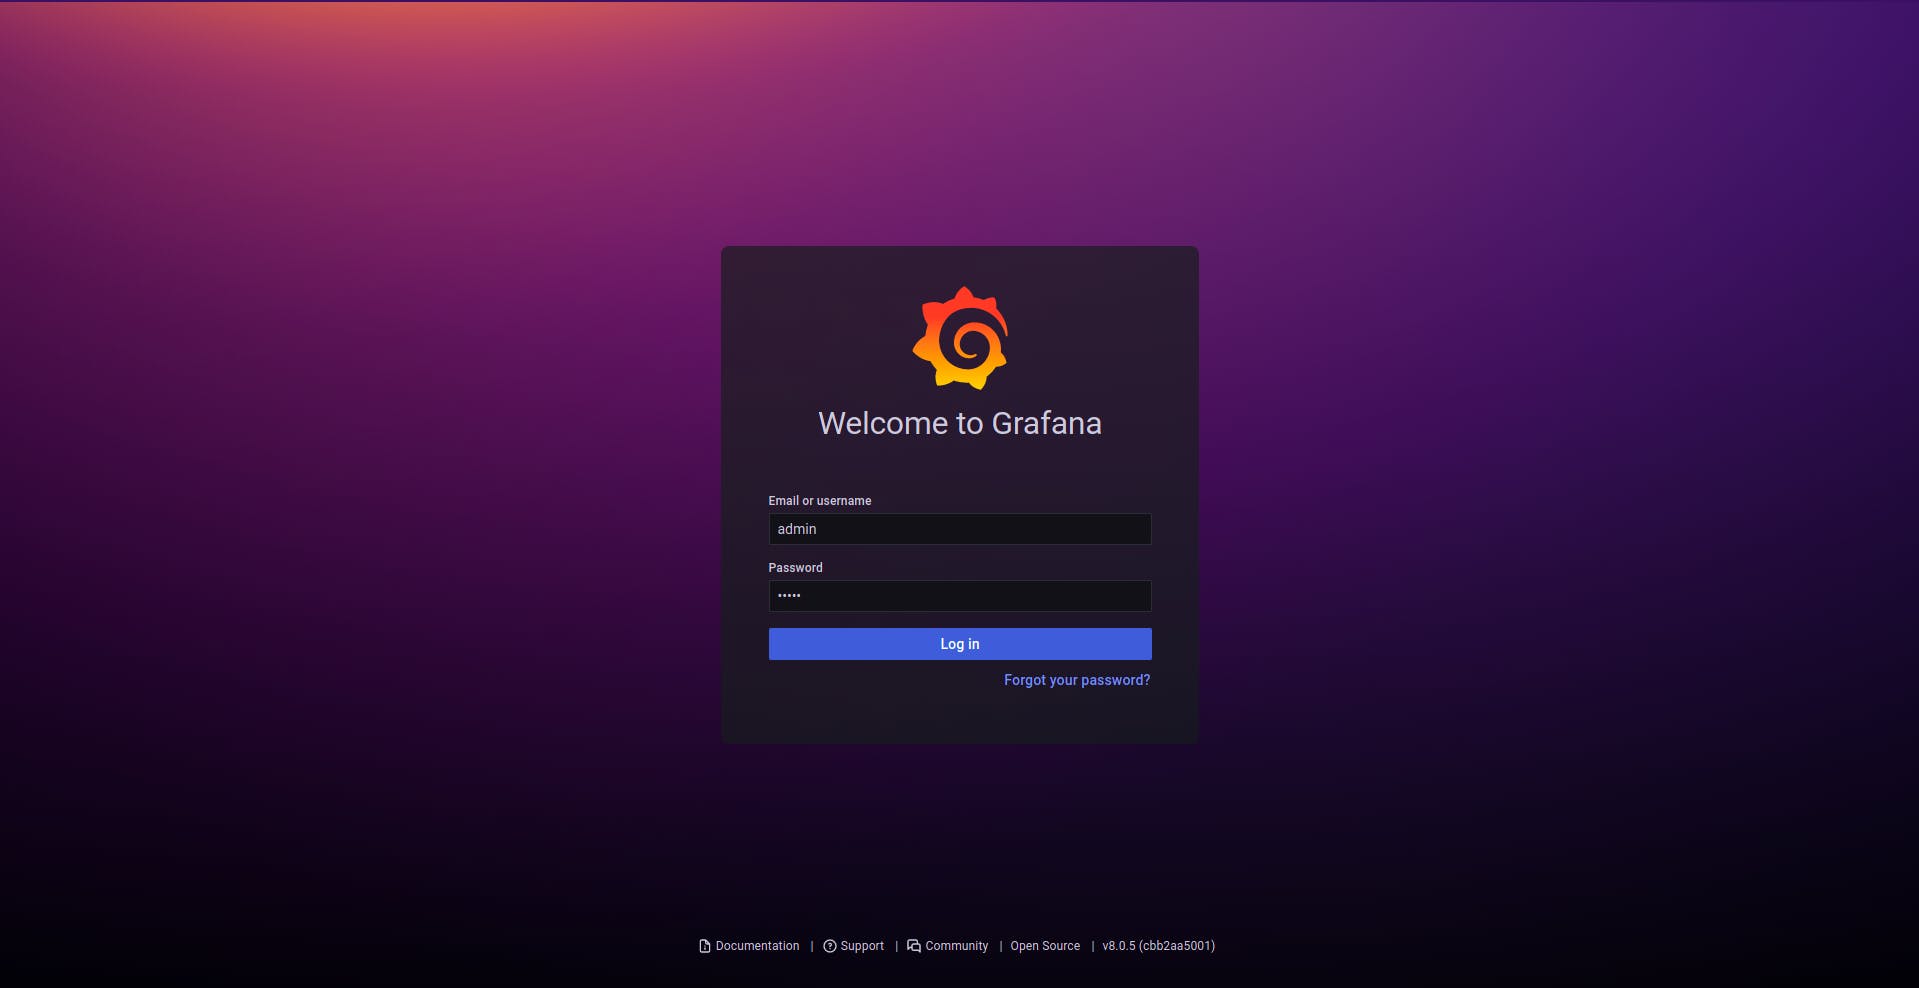
above stack file also contains a grafana instance, which will be available to YOUR_SERVER_IP:3000
Go to Grafana Dashboard, Initial credentials will be admin:admin
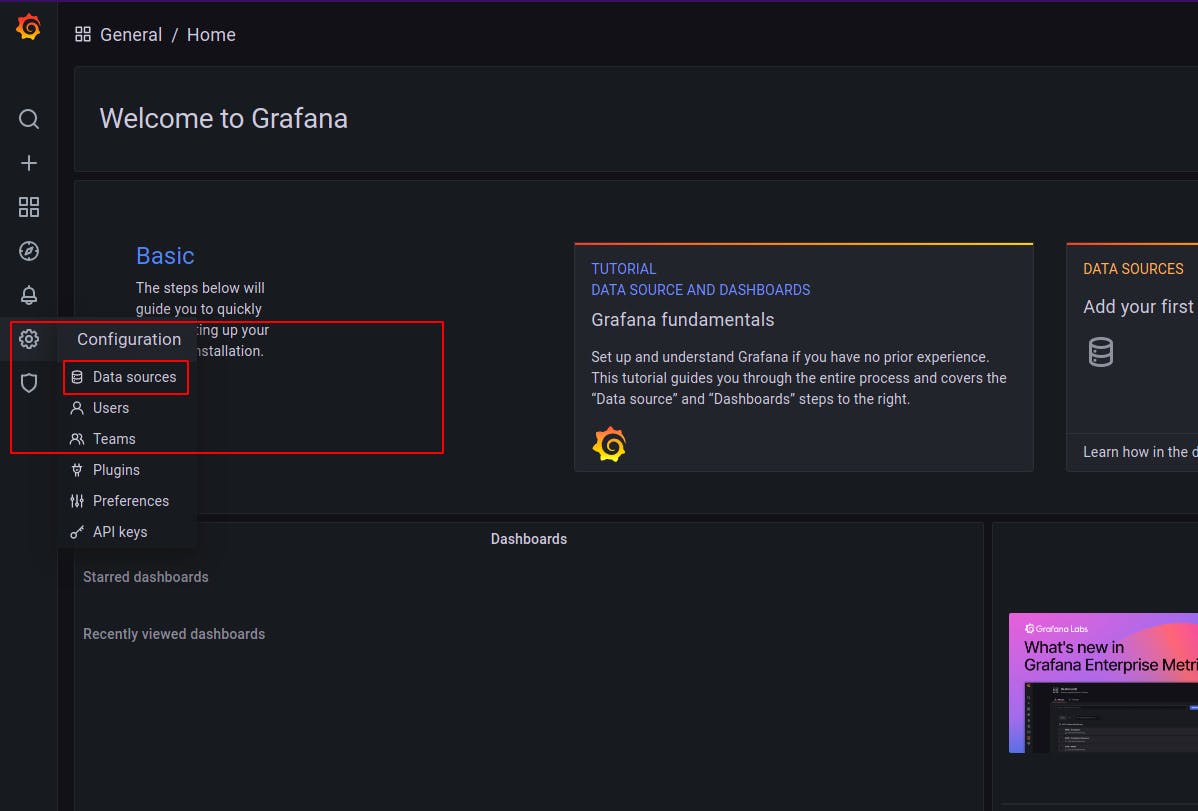
Go to Configuration > Data Sources as displayed in the picture.
Now Click on Add Data Source and enter the URL as http://loki:3100
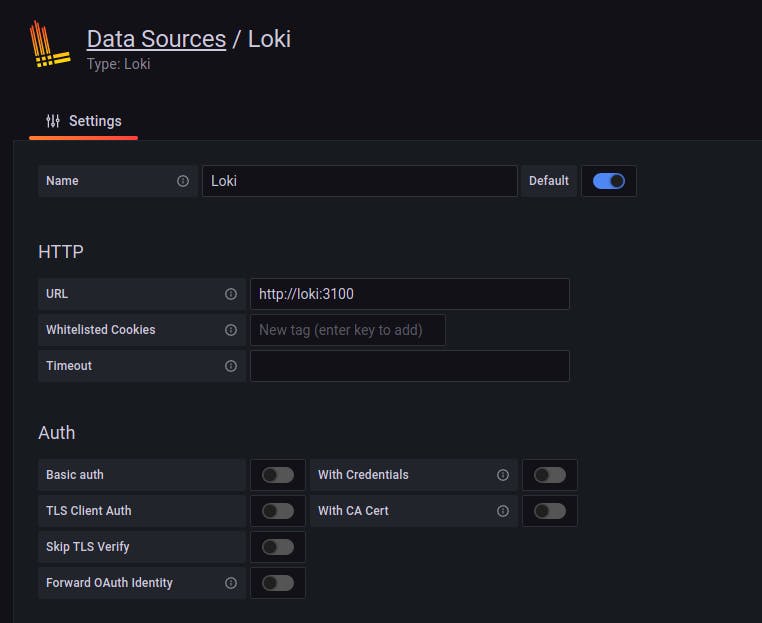
If you have done everything correctly till this point, Clicking Save & Test will emit a success message.
❓ Just one question out of curiosity... We did not enter a IP or Domain Name, then How did it figure out our Loki instance correctly ? 🤔
The answer is : Check the docker-compose file, the loki service is named as loki, and other containers can reach to this container by the service name, which is in our case is loki.
Every container has by default a nameserver entry in /etc/resolve.conf, so it is not required to specify the address of the nameserver from within the container. That is why you can find your service from within the network with service or task_service_n.
Using Grafana
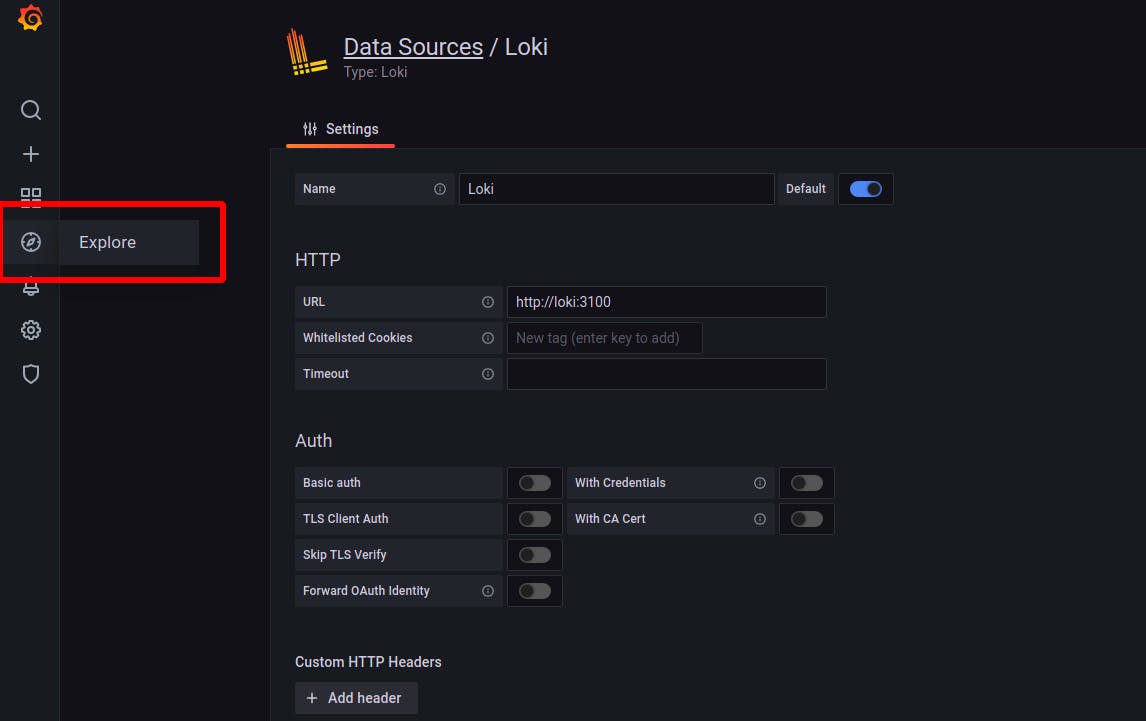
Once you have added the Data Source, Go to Explore as instructed below:
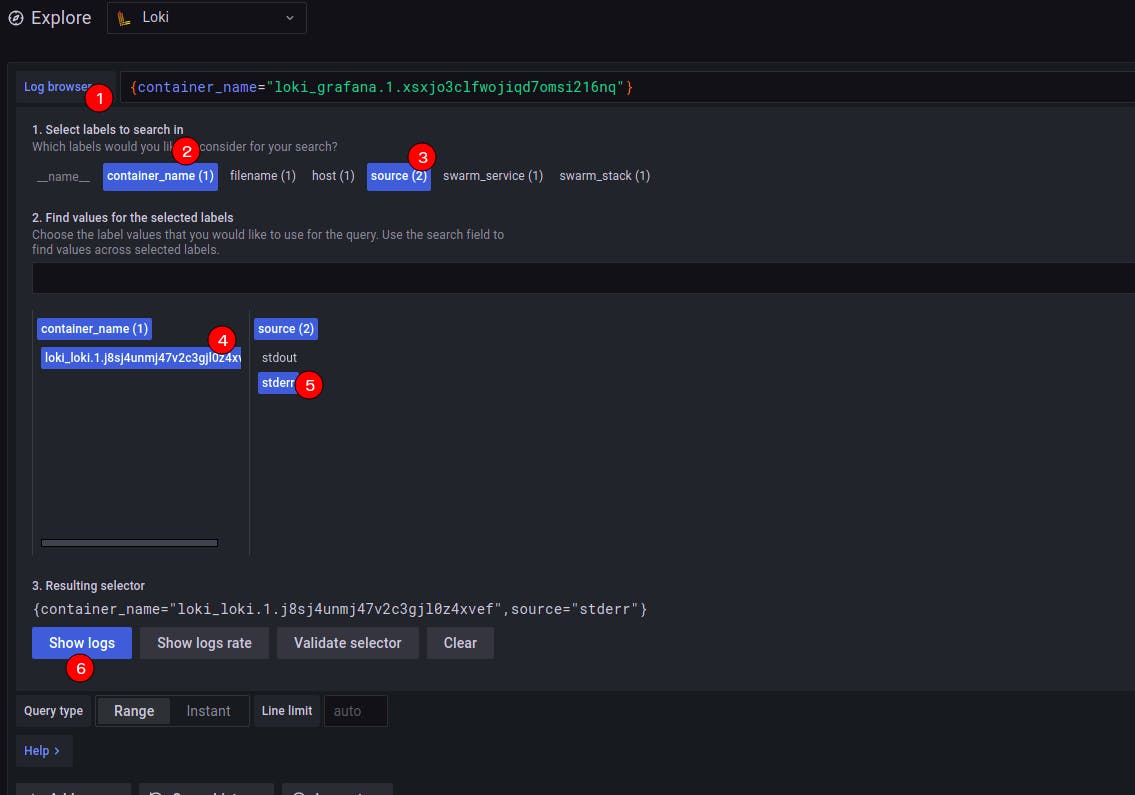
Select a container to view its logs
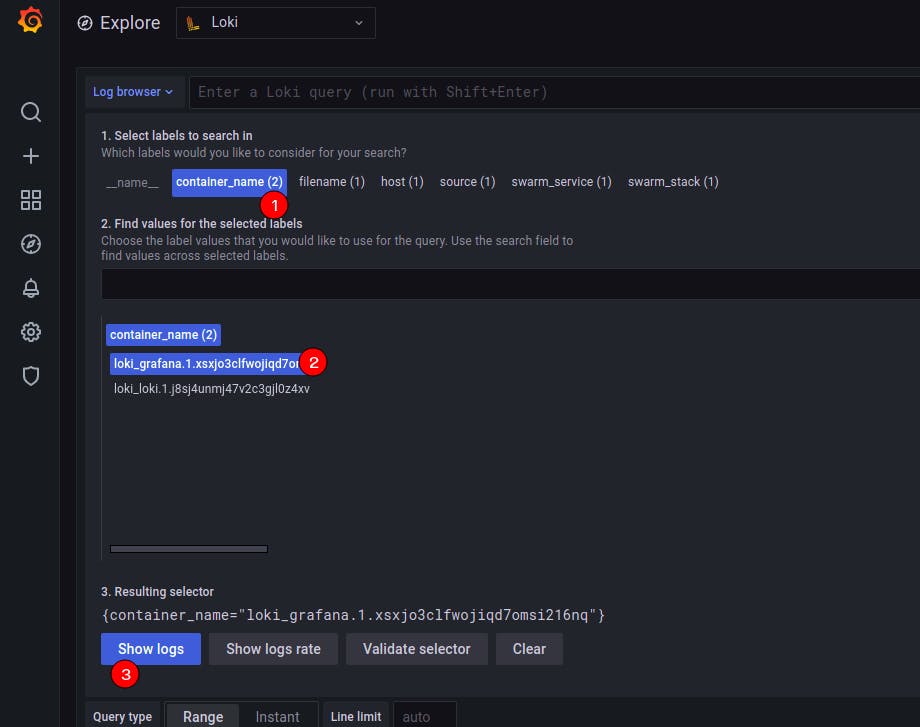
Just like the image below, you can check logs of host, stdout & stderr streams, containers, Docker services, Docker stacks, etc. You can also combine multiple filter to get a consolidated output of your choice.
Security Measures
- Block the internet access on Loki port 3100 (+ Grafana Port 3000 if you want). Using Firewall is heavily recommended. As the official docs says, Loki does not come with any included authentication layer, So it would be good if you allow only specific IPs.
- If you want to make it more secure, set up an NGINX reverse proxy with Basic Auth. [For Production Environments]
Making it more Fault-Tolerant and HA
If you want to take this on a whole next level, well, there is good news for you, for the storage part you can also use Cloud DBs like DynamoDB for index and S3 for storing chunks. You can read storage options here.
My excited Indian ass dances like this whenever I complete any setup :) We all love that feeling, don't we?
Anyways, Thanks for reading and bearing all my content and The Office GIFs! Hope you got some knowledge from this blog, I am just writing what I am thinking, still trying to making it as simple and straightforward as possible.