Best Solution for Collecting Logs/Metrics for AWS EC2
Let's check how we can use AWS CloudWatch Agent to scrap metrics and logs from EC2s in a very simple and effective way.


🪔🪔🪔🪔🪔🪔🪔
Problems -
Suppose you have a web server, deployed on AWS EC2. Now to check your app logs you have to SSH to that EC2 and then cat the logs.
Or when you wanted to check some metrics for that EC2, you went to the built-in CloudWatch metrics section on the EC2 dashboard page aka Monitoring. You checked the CPU utilization... that's great! but wait, now you wanted to check current RAM usage or Swap memory usage or Disk Usage.
Wait, what? What did you observe? There are no metrics available for RAM/Swap/Disk usage? Now what?

Make a Wish🌠
I wish I had some simple solution🤞, using which I can check my logs and unlock a few more metrics that are not available to CloudWatch metrics by default, like how much space is left in my EBS volume or how much RAM is being utilized.
The Solution
Don't worry! The unified CloudWatch Agent is here for the rescue!
Features
- Collect internal system-level metrics from Amazon EC2 instances across operating systems.
- Collect system-level metrics from on-premises servers.
- Retrieve custom metrics from your applications or services using the StatsD and collectd protocols.
- Collect logs from Amazon EC2 instances and on-premises servers, running either Linux or Windows Server.
How to set up Cloudwatch Agent for Logs/Metrics Collection?
Assumption
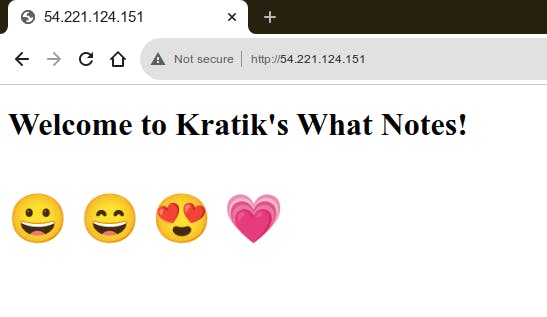
I am assuming that you have a web server that serves a beautiful web app something like below (and it is generating some access and error logs):
Note - If Some Images are not clear due to big dimensions, just open them in a new tab, They will become the full-size image and you will be able to see the content clearly. The Images which I think need to open in a new tab once, I have made them clickable explicitly! So Enjoy :)
Installation of CW Agent
Install the agent using the command line for your OS. FYI, I am using Ubuntu 20.04. Head over to this AWS Documentation and follow the steps.
Download the DEB Package
wget https://s3.amazonaws.com/amazoncloudwatch-agent/debian/amd64/latest/amazon-cloudwatch-agent.debInstall the package
sudo dpkg -i -E ./amazon-cloudwatch-agent.deb
Setting up IAM Permissions
No Matter If you using AWS EC2 or an On-Prem Server, you need to provide proper permissions using IAM so the machine can access and post metrics/logs to Cloudwatch!
For now, Let's take an example where we are using EC2, for on-prem servers, you can go through this documentation which will give you an idea around setup.
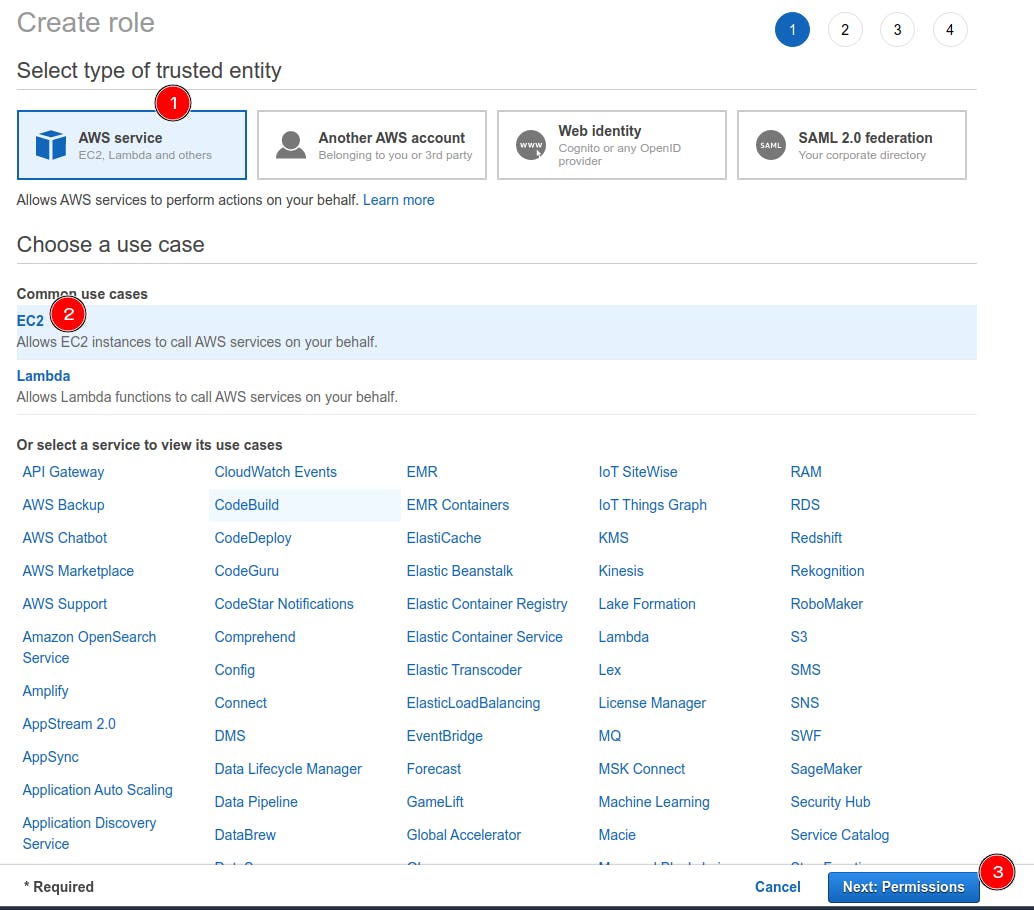
Create an IAM role. Select AWS Service, then EC2 and click on Next
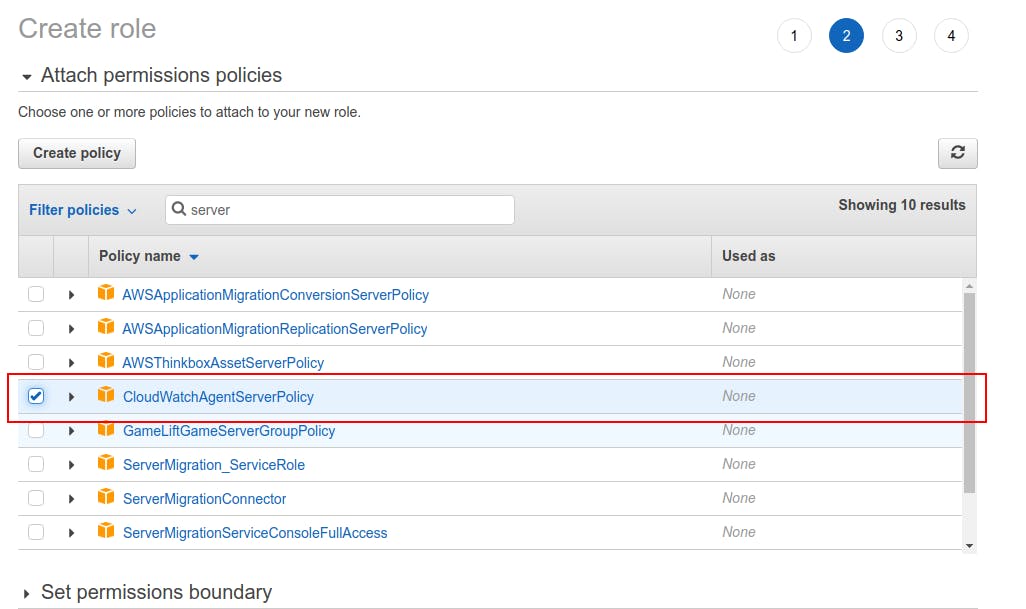
In Attach Permissions, select a managed policy named CloudWatchAgentServerPolicy
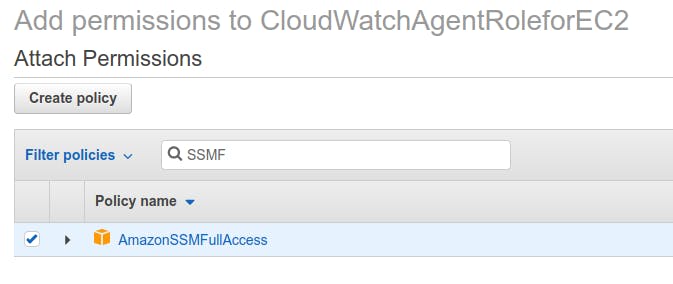
Bonus - Later on, you will be creating a configuration file for CloudWatch, best practice here is that you save this config to AWS Systems Manager in the Parameter Store. You can use it later, also, you can modify it as per your needs. So for that, you need to add permissions to access SSM Param Store. Attach the policy for that as shown below.
Click Next, Supply some apt name for it and Finish the creation of Role.
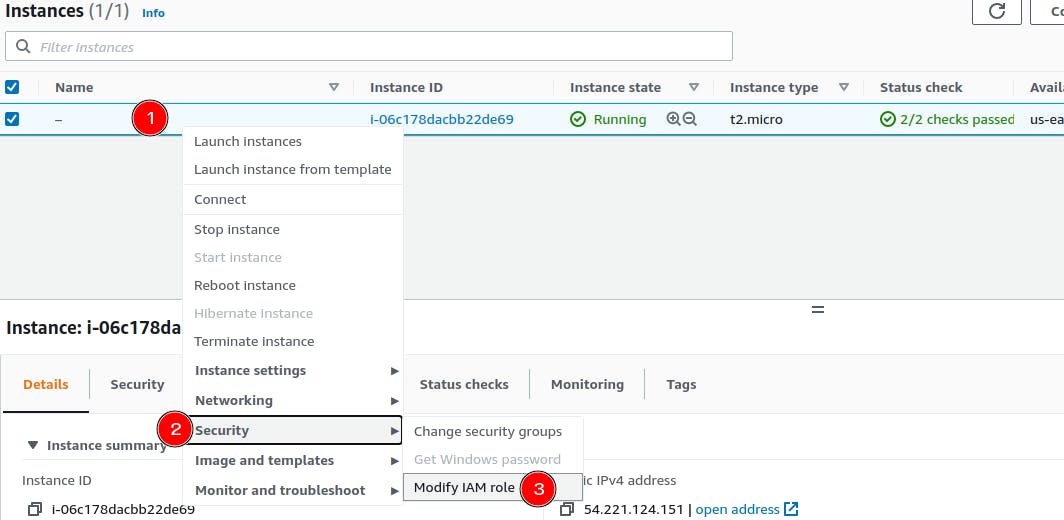
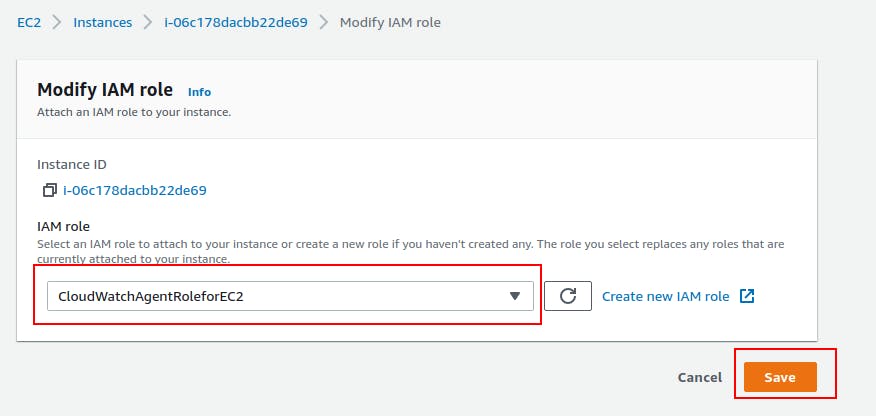
Now, Go to EC2 Dashboard, select your EC2, Right-click for options, Select Security, then Modify IAM role and attach this newly created role.
Create CloudWatch agent configuration file
We have to instruct the CloudWatch agent that from where to fetch logs, what metrics to scrap, etc. For that, we need to create/generate the config file. We can do it manually or we can generate the file using a wizard. (Recommended) Follow this Docs to get started.
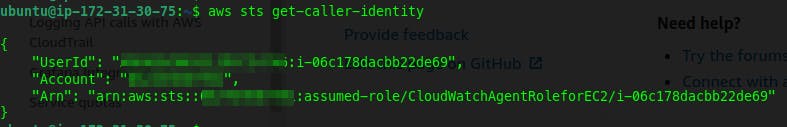
Before that, let's verify that our role is attached to our EC2!
Install AWS CLI
sudo apt-get update && sudo apt-get -y install awscliCheck what is the current entity, which is attached to our EC2
aws sts get-caller-identityIf You get some output like below, you are good to go, else recheck all the steps!
Run the wizard by running the following command:
sudo /opt/aws/amazon-cloudwatch-agent/bin/amazon-cloudwatch-agent-config-wizardI have used asciinema to record what parameters it asks, you can follow the same to make it work! I have chosen advanced metrics with a high-resolution time frame. + For the log part, I have to give the path of my log file which will be read and the content of it will be sent to CloudWatch. You can check these logs in the CloudWatch Logs later. If you see the recording below you'll see I have put the name of CloudWatch Log Group as
access.log
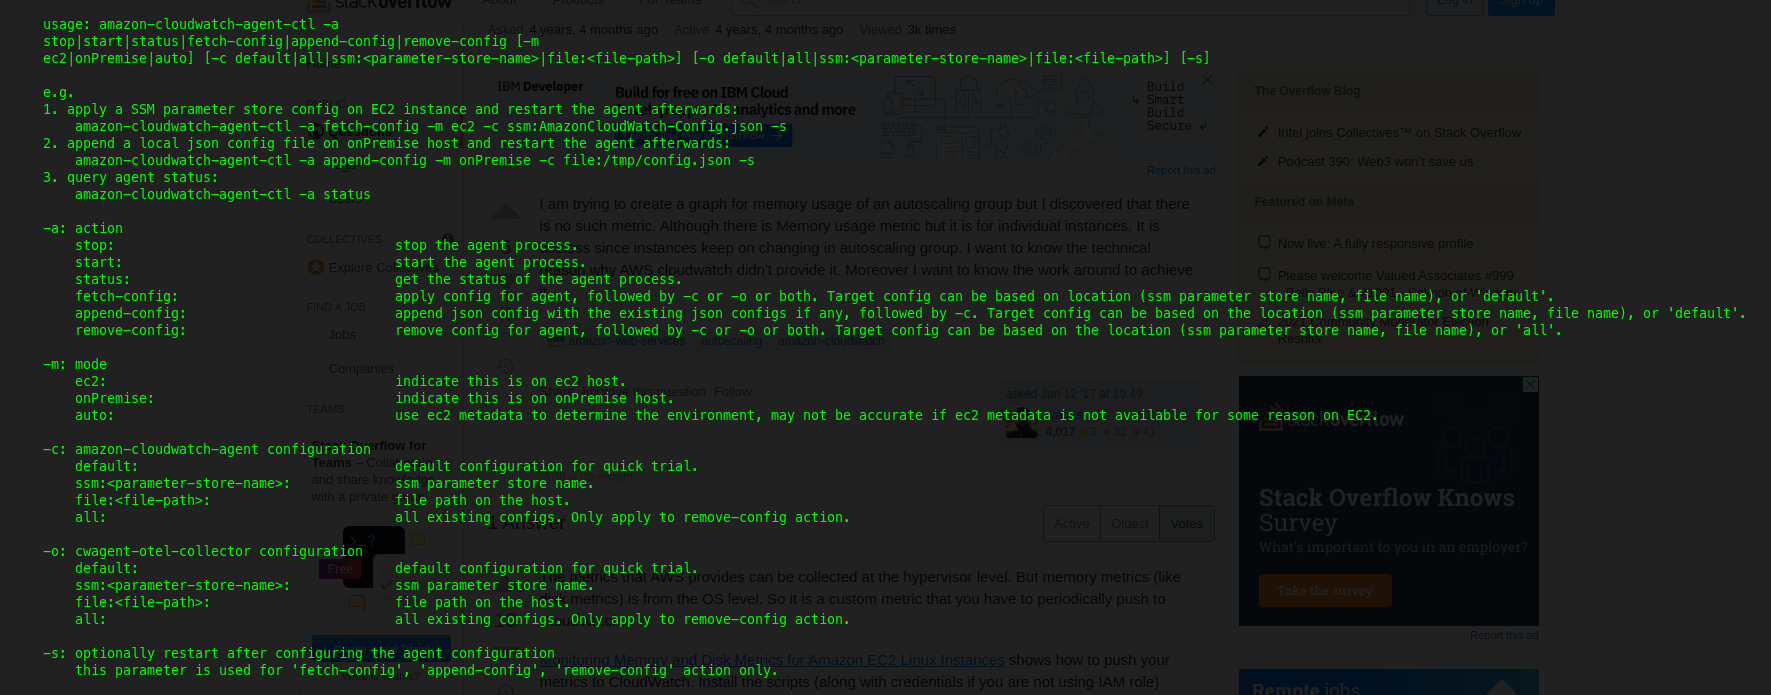
That was not it :) Once you have done start the agent using the
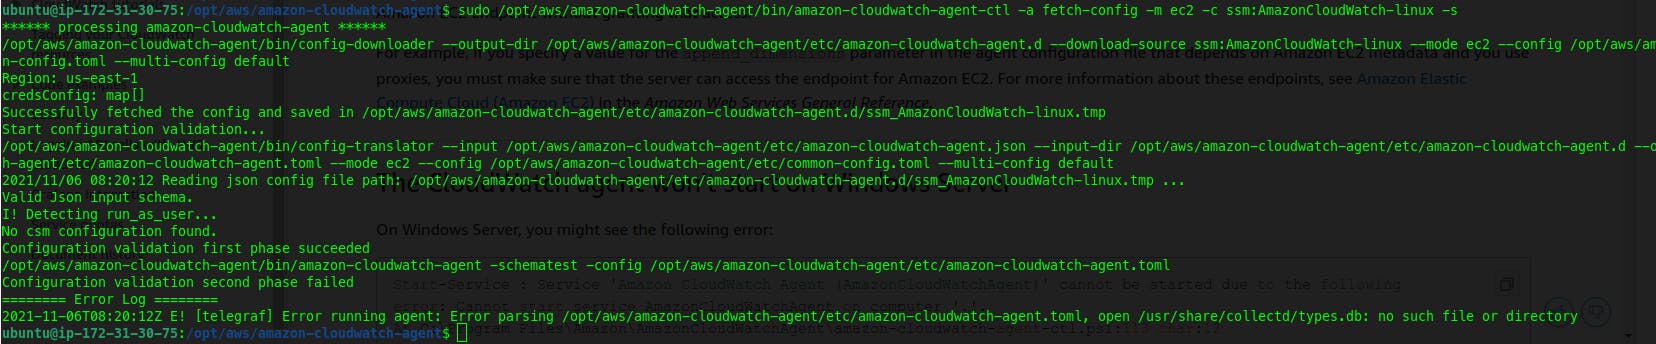
amazon-cloudwatch-agent-ctlutility :sudo /opt/aws/amazon-cloudwatch-agent/bin/amazon-cloudwatch-agent-ctl -a fetch-config -m ec2 -c ssm:AmazonCloudWatch-linux -s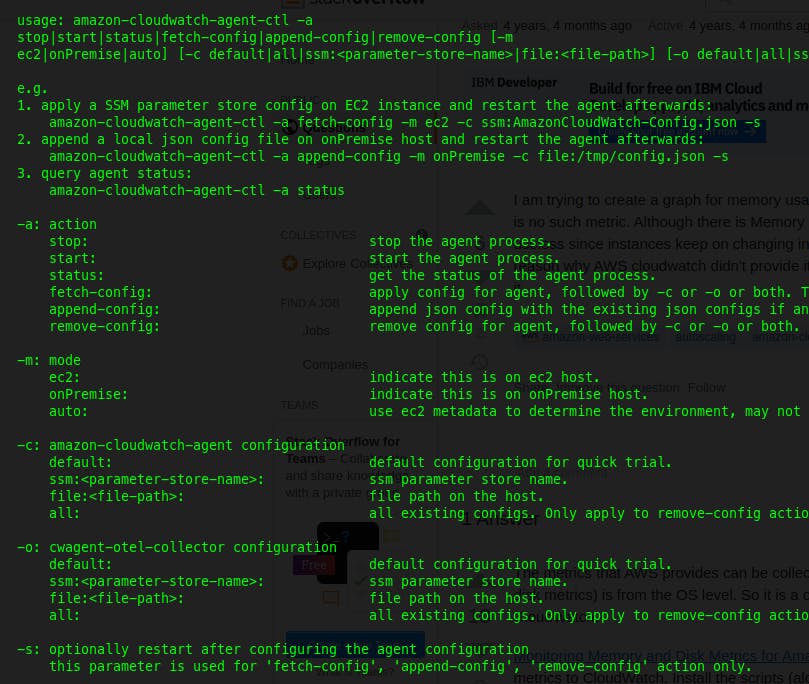 Output

I got some errors when I fired the above command, a file called
types.dbwas missing in thecollectddirectory! Create both the things :sudo mkdir /usr/share/collectd/ sudo touch /usr/share/collectd/types.dbLet's Re-run the agent :
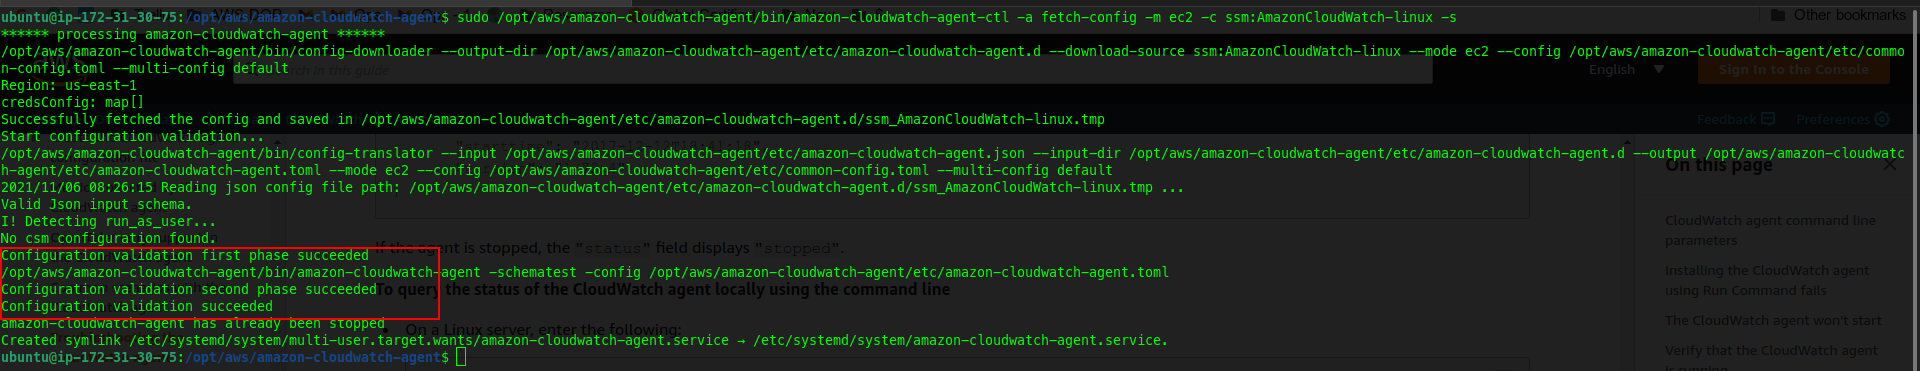
sudo /opt/aws/amazon-cloudwatch-agent/bin/amazon-cloudwatch-agent-ctl -a fetch-config -m ec2 -c ssm:AmazonCloudWatch-linux -s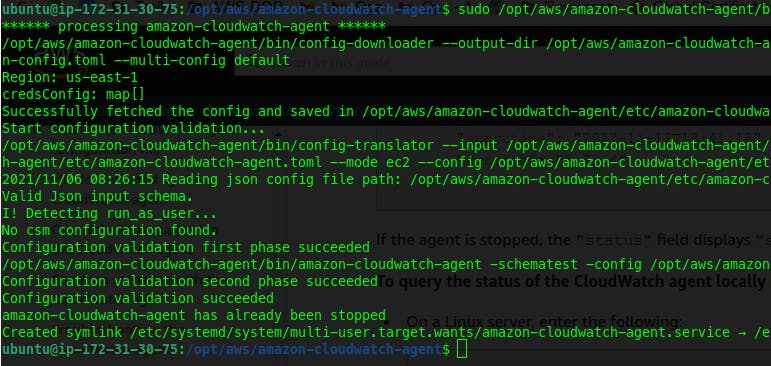 From Above Screenshot, I think you can conclude that the run was successful.
Let's verify in the CloudWatch, Check logs. In AWS Console, Go To Cloudwatch > log groups
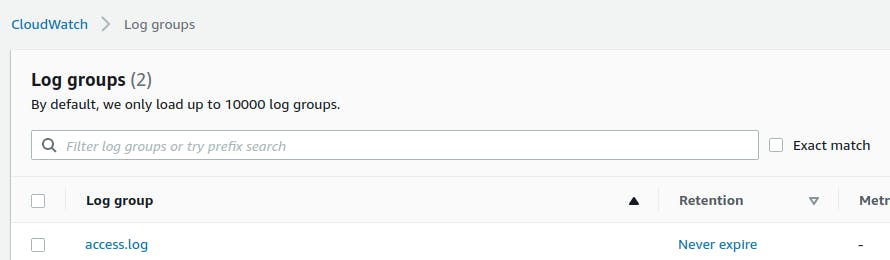
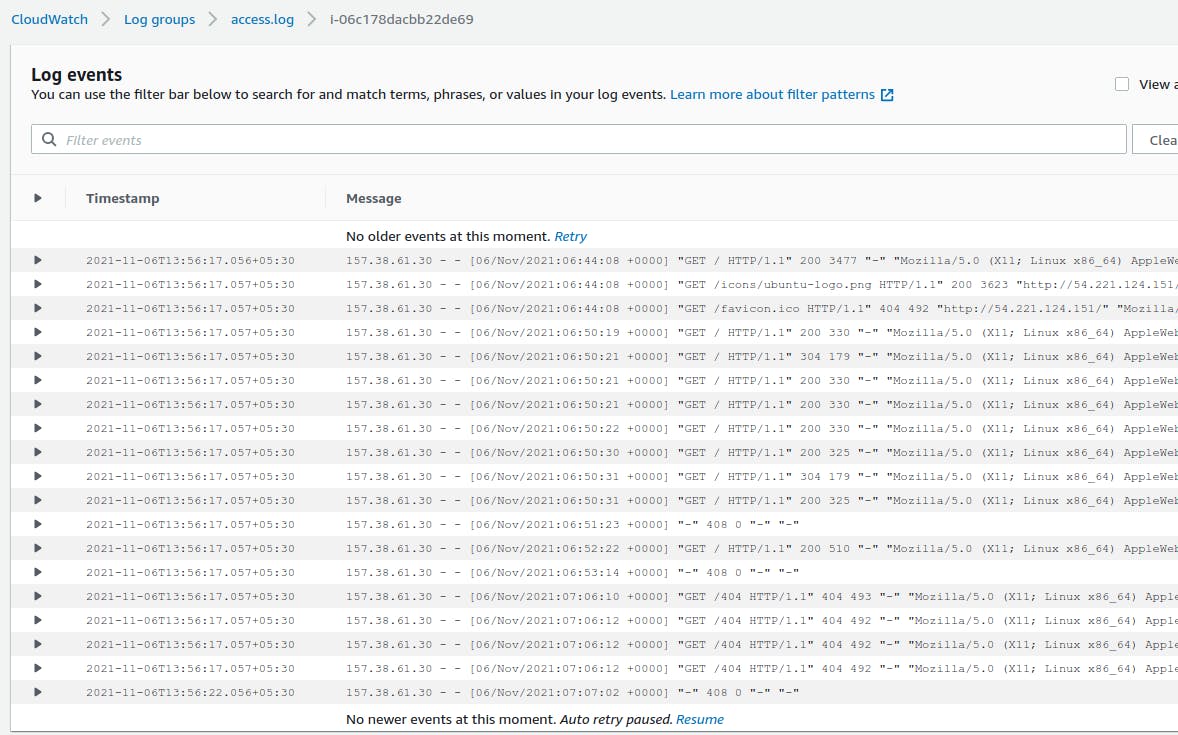 You can see that our log group is created and logs are also there :)
 Let's Verify the Metrics, Go To Cloudwatch > Metrics > All Metrics. You'll see something like this:
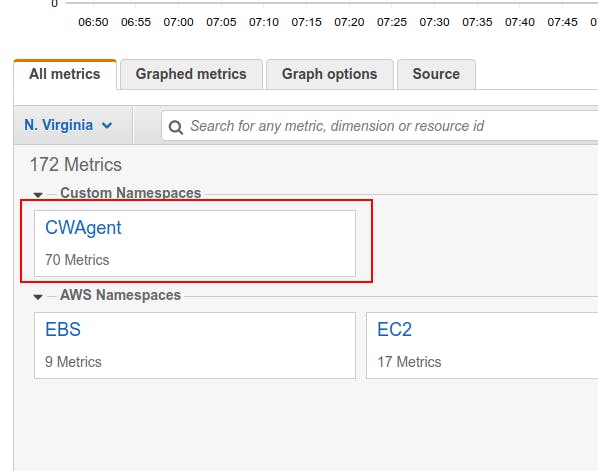 This means that metrics scraped by CW Agents are available.
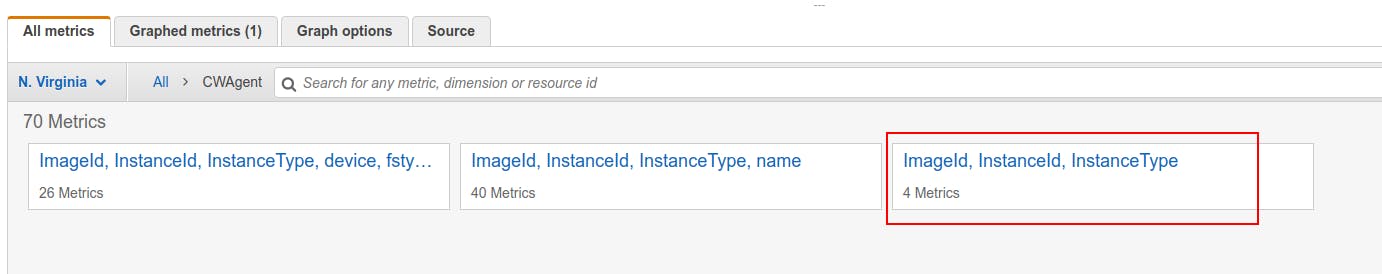
Open CWAgent Metrics and select below metrics group :
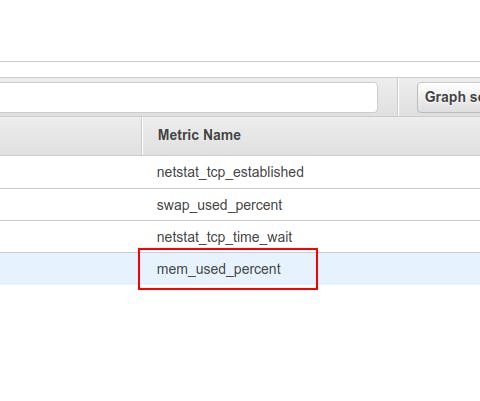
From Here, select the row which have mem_used_percent
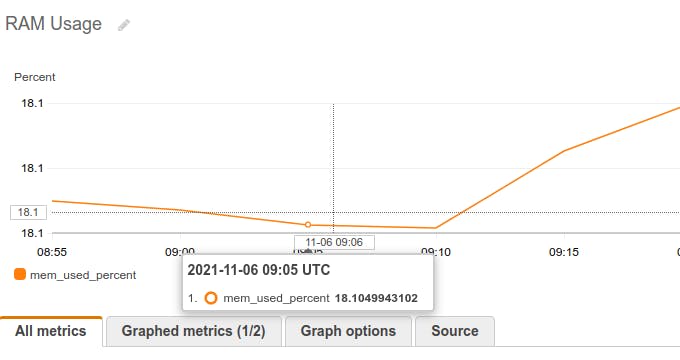
You will be able to see the graph of Memory Usage
Now as you have both, App logs and Advanced Metrics (which are not enabled by default in CloudWatch), Possibilities are infinite. You can create your CloudWatch alarms based on these metrics. You can keep an eye on logs efficiently without logging in to the server.

Extra - Why AWS CloudWatch does not have Memory usage metrics
The default metrics which AWS provides come from the Hypervisor level so we don't have to do anything special to see those. But for some metrics like Memory Usage, Disk Usage you have to get those metrics from the OS level. That's why we had to install an agent on the OS.
References:
AWS Official Documentation - Amazon CloudWatch
Installing the CloudWatch agent - AWS Docs
Drop Some Emojis if you find this useful. Or leave a comment, That's how I will know what I can improve :)
Thanks for Reading! 🙇♂️